VFGEN
  • Home
  • Download
  • Support
  • User's Guide
  • §   Vector Field File
  • §   ADOL-C
  • §   AUTO
  • §   Check
  • §   CVODE
  • §   DDE23
  • §   DDE-BIFTOOL
  • §   DDE_SOLVER
  • §   Delay2ODE
  • §   DSTool
  • §   EVF
  • §   GSL
  • §   Help
  • §   Javascript
  • §   LaTeX
  • §   LSODA
  • §   MATCONT
  • §   MATLAB
  • §   Octave
  • §   PDDE-CONT
  • §   PyDSTool
  • §   PyGSL
  • §   R
  • §   RADAU5
  • §   Scilab
  • §   SciPy
  • §   Taylor
  • §   XPP

PyDSTool

From the PyDSTool wiki: "PyDSTool is an integrated simulation, modeling and analysis package for dynamical systems, written in Python."

The VFGEN PyDSTool Command

A Python file that can be used with PyDSTool is created by the command

$ vfgen pydstool vector_field_file.vf

This command creates the file [name].py, where [name] is the name of the vector field given in the vector field file. The file defines the function args(), which returns an "args" object that can be used to create a PyDSTool Generator.

Options

demo If the option demo=yes is given, the file [name]_dst.py 
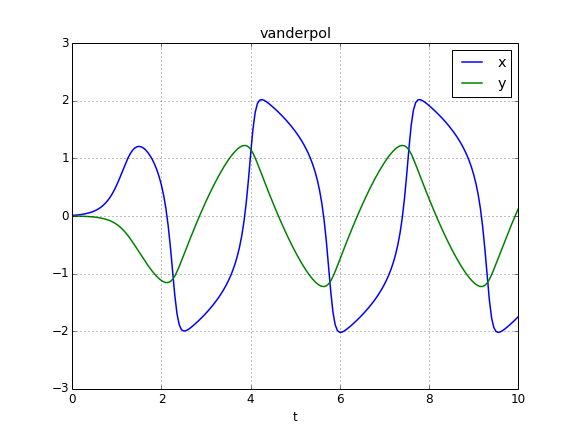
is also created. This program provides a sample Python script that uses a Generator to plot a solution to the differential equations. The initial conditions and parameter values for the solution are the default values defined in the vector field file.
Default: demo=no

Example 1

Here is a sample vector field file: vanderpol.vf.
The files created by

$ vfgen pydstool:demo=yes vanderpol.vf
are
  • vanderpol.py
  • vanderpol_dst.py

The command

$ python vanderpol_dst.py
created the following plot.
Graphs of x(t) and y(t)

Example 2

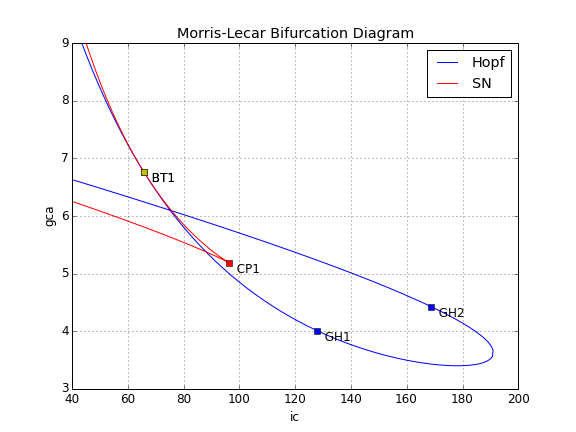
In this example, we use the PyCont subpackage of PyDSTool to compute a two parameter bifurcation diagram for the Morris-Lecar equations.

A vector field file for the Morris-Lecar equation is MorrisLecar.vf. We generate the file MorrisLecar.py with the command

$ vfgen pydstool MorrisLecar.vf
This file is used in the Python script MorrisLecar_cont.py. Here is a transcript of running this script:
$ python MorrisLecar_cont.py
Setting up for one parameter continuation of an equilibrium point.
Computing the curve.
LP Point found
LP Point found
H Point found
Setting up for two parameter continuation of the Hopf point.
Computing the curve.
...forward
GH Point found
GH Point found
...backward
BT Point found
Setting up for two parameter continuation of the first limit point.
Computing the curve.
...forward
...backward
CP Point found
BT Point found
Generating the plot in MorrisLecar_cont.png.
$
The following plot shows the result:

Copyright © 2005-2014 Warren Weckesser
() [] {} 