R files that can be used with the deSolve package are created by the command
The main file created is [name].R, where [name] is the name of the vector field given in the vector field file. This R file will contain the functions [name] and [name]_jac.
| func |
If the option func=yes is given,
VFGEN also converts any user-defined functions in the vector field file
into functions in the R file. For each user-defined function, two R functions
are created. One can be used as a rootfunc with the ode function.
The other accepts two arguments: a solution returned by ode and the
parameter variable that was given to ode.
Default: func=no |
| demo |
If the option demo=yes is given,
the file [name]_demo.R is created. The R file
contains a script that uses ode to generate
a plot of the solution to the differential equations.
Default: demo=no |
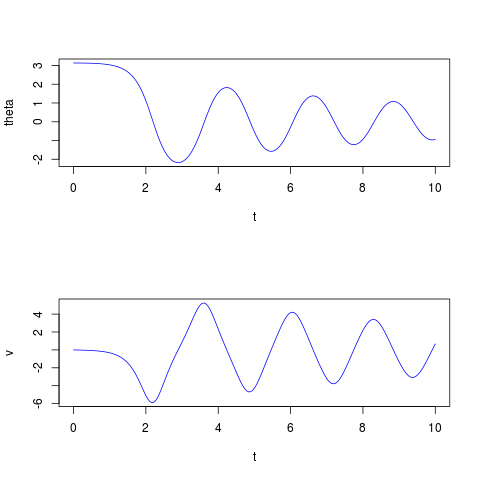
Here is a sample vector field file for the differential equations of a pendulum: pendulumv.vf. The file includes two user-defined function. One computes the energy of the function, and other, defined as
simply returns the v coordinate of the pendulum.
The files created by
The script pendulumv_demo.R generates the following plot:
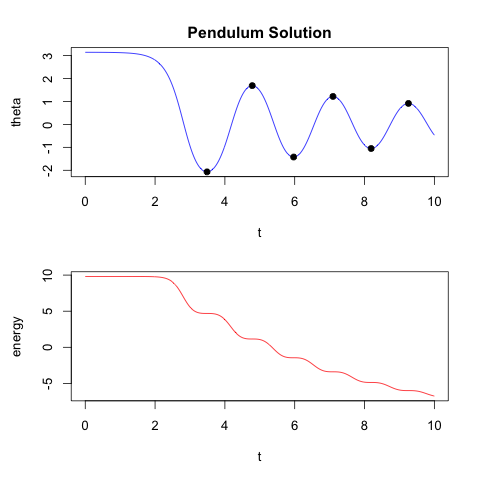
The demonstration script shows only the most basic use of ode. Another example is the script plot_pendulumv_solution.R, which demonstrates the use of user-defined functions to find the points where the velocity is zero, and to compute the energy of the solution as a function of time. It generates the following plot.
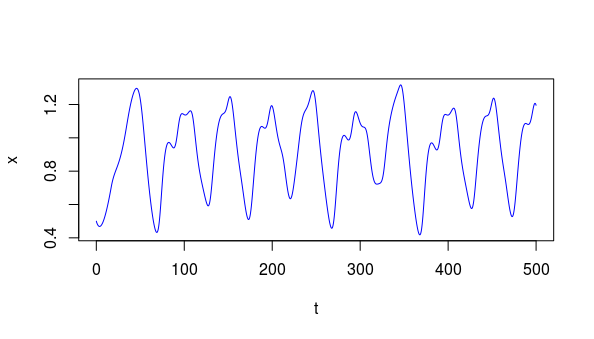
The Mackey-Glass delay-differential equation is $$x'(t) = -bx + \frac{ax(t-\tau)}{1 + x(t-\tau)^{10}}$$
Here is the Mackey-Glass vector field file: MackeyGlass.vf.
The files created by
The default time interval use in MackeyGlass_demo.R is 10 time units. This can be changed by editing the line that defines the times sequence to be, for example,
times = seq(0, 500, by = 0.25)After making this change, the demo script generates the following plot: